AWS Database Blog
Complement Commercial Intelligence by Building a Knowledge Graph out of a Data Warehouse with Amazon Neptune
This is a guest post from Shahria Hossain, Software Engineer, and Mikael Graindorge, Sales Operations Leader at Thermo Fisher Scientific.
The continuous expansion of data volume is a growing challenge for businesses to produce strategic solutions for their customers. Thanks to innovative approaches, these challenges have become simpler to solve with the rise of new cloud-based database technologies. Data warehousing is a popular option for teams performing analytics, but developers may be seeking alternative methods for transforming how business intelligence operations are conducted within their organizations using a more diversified set of technologies. Graph databases are highly desirable for businesses who wish to transform their analytics platforms. Thanks to Amazon Neptune, our team at Thermo Fisher Scientific has built a graph database out of a data warehousing platform that has shown massive utility for supporting business intelligence analytics across the organization.
Thermo Fisher Scientific is a life science company dedicated to supporting the research, development, and manufacturing needs of the greater scientific community with the goal of making the world healthier, cleaner, and safer. The commercial team at Thermo Fisher Scientific is a highly analytics-oriented business function focused on building innovative applications that improve how commercial operations are conducted within an organization that touches a large scientific customer base requiring mission-critical products. As a part of the global innovation team, we use Neptune to build a knowledge graph that supports engineers, analysts, and data scientists in their journey toward developing applications that improve commercial efforts across the organization. One particular application we have built using this knowledge graph is a recommendation system that provides our customer-facing end users with products they can suggest to their clients based on the behavior of similar clients within our knowledge graph. Our commercial team uses it to support our customers at the right time with the right product to fulfill their scientific needs. This post highlights how we built this Neptune knowledge graph from an existing AWS data warehousing ecosystem, and the process we used to integrate strategic relationships into the knowledge graph so that we could extend its use to serve as a recommendation system.
Relational database vs. graph database
Business analysts working with data warehouses perform their data manipulation and querying tasks using relational database queries (SQL) due to its simplicity and familiarity. However, you may find that certain analyses require working through multiple layers of joins and aggregations to obtain desired results. The more entities involved in the analysis, the more layers of complex data manipulations may be necessary; this complicates the overall declarative coding process, and may result in high latency each time the queries are run. These queries may also be difficult to understand and decipher, especially if the individuals who wrote them don’t explain the relevant logic.
Graph databases, on the other hand, are purpose-built with relationships as first-class citizens. Traversing these relationships for insights are procedural in nature, which decreases the time and complexity associated with retrieving highly connected data across domains. Queries are built so that the analyst knows exactly where to start and end to discover what they need. Powerful algorithms are built into graph query languages to help solve problems using step-wise traversals that may not be possible with relational databases. This makes graph databases good at delivering powerful insights from highly connected datasets to end-users and applications.
Although graph databases enable querying capabilities that may be difficult to replicate using a data warehouse, there is clear utility to data warehouses that makes them irreplaceable in an analytics ecosystem. They are easy-to-use, performant, and a good option for individuals who are trained on using SQL. Upon extensive exploration of these analytics solutions on the cloud, our team has concluded that both data warehouses and graph databases should work cohesively in an analytics ecosystem to allow the best tool to be available for workloads of varying nature and complexity. Graph databases are well-suited for multidimensional analyses that would otherwise be difficult to perform with relational databases, and relational databases can be utilized for heavy, compute-intensive, batch aggregation workloads that would be difficult to perform with graph databases. So how can a team build out a knowledge graph that works in tandem with a data warehouse? The commercial team at Thermo Fisher Scientific has designed such a bridge, and the solution involves a robust data warehousing solution that is expanded to build out a knowledge graph, all on the AWS Cloud.
Building a knowledge graph out of a data warehouse
Our analytics ecosystem is heavily reliant on data warehousing. We use data surrounding customer behavior, internal operations, marketing campaigns, customer account structure, and more to provide meaningful insights to improve commercial efforts in the company. This process starts with ingesting transactional data from a wide variety of internal and external source systems, which is then wrangled, analyzed, and integrated into applications for the end-user to access. The following diagram provides a high-level overview of how we collect datasets from various source systems using Python in order to implement this data engineering process.
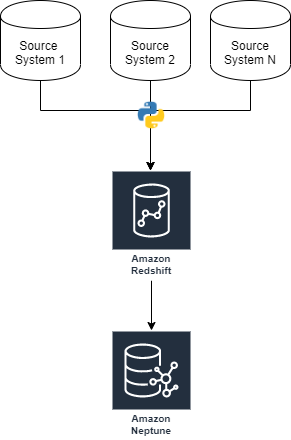
Using Python scripts and SQL transformations allows us to build custom data ingestion pipelines for a data warehouse that is well-suited for the needs of downstream dashboards, reports, and applications. This approach works well for us because it provides a centralized source of truth for our data that originates across source systems. Preserving our Amazon Redshift data warehouse and centralizing it within our analytics ecosystem has proven essential to our analytics efforts thus far. Therefore, we have developed our Neptune knowledge graph as a derivative of this Amazon Redshift data warehouse. The next section highlights how we built the data integration pipelines at scale to bridge these two dissociated platforms.
The graph database ETL process
Our solution architecture for migrating existing relational data in Amazon Redshift to a graph model in Neptune uses the powerful data unloading capabilities of Amazon Redshift in conjunction with the bulk loading capabilities of Neptune. This process is simplified into four steps, as described in the following diagram.
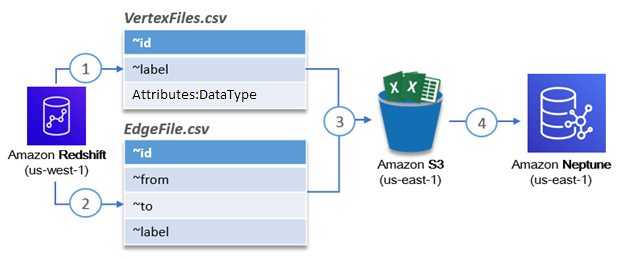
- Steps 1 and 2 – Unload the data of interest from Amazon Redshift as CSV files with the proper bulk load formatting
- Step 3 – Copy the files to an Amazon Simple Storage Service (Amazon S3) bucket in the same region as Neptune
- Step 4 – Invoke the Neptune bulk loader API to load the relationships specified in the CSV files
The Neptune bulk loader API makes it extremely simple to load in a lot of relationships very quickly. For our use case, we loaded over 300,000 vertices and 16 million edges within 10 minutes. The speedy bulk unloading capabilities of Amazon Redshift combined with the fast bulk loading capabilities of Neptune makes it possible to migrate large volumes of data between the data warehouse and graph database efficiently. You can easily add additional datasets as long as you know which entities and relationships you want to migrate from the data warehouse to the graph. The graph database is now ready to be utilized for analytics, but it’s also important to consider proper maintenance of the solution.
Our bulk loading approach to keep data updated in Neptune involves configuring automations using AWS Step Functions to replicate changing data between the data warehouse and Neptune. When we first started, our graph was relatively small (less than 10 million relationships between 200,000 vertices) so it was possible to drop and reload the graph on a schedule to keep the data fresh. However, because the graph is growing, performing full truncate-reload operations on the cluster is inefficient. Approaches to dropping the graph faster using parallel processing exist, but we decided to develop a custom application for performing incremental load operations. This incremental change data capture is similar to traditional ETL approaches of capturing changing data between transactional and analytics systems. Although it’s currently in development, it would work by analyzing metadata about the most recent data loaded into Neptune, then bringing in the added or changed fields from Amazon Redshift from each of the original data sources. To further account for anomalies, a full historical flush will also be performed on a schedule during maintenance windows.
Data analysis with Neptune
Now that the graph is loaded and the source data refresh is automated, we can start using it for analytics. In the following example, we perform the bulk load procedure highlighted earlier to load in simple behavioral relationships between labs and products to Neptune. We convert from our data warehouse’s relational database model to a graph data model, as in the following diagram.
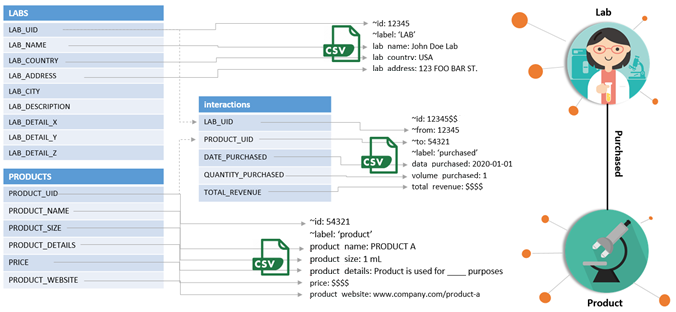
Simply using relationships between these two vertices, we can answer difficult business intelligence questions such as:
- What products should I recommend to a lab based on their interactions with related products?
- What is the behavior overlap between two labs that are at maximum five hops away?
- What is the most similar or dissimilar lab to a given input lab?
- What products are the most similar labs buying that an input lab isn’t buying?
We used Gremlin as our traversal language to build queries that help solve these types of questions to provide a proof of concept. Referring to well-documented resources, such as the Apache TinkerPop project, made the process of learning the Gremlin traversal language intuitive. We started off with simple queries to understand our graph:
- Count the vertices in our graph –
g.V().count() - Count the vertices in our graph that are labs –
g.V().hasLabel(‘lab’).count() - Find all purchased products –
g.E().hasLabel(‘purchased’).outV().hasLabel(‘product’)
From here, we kept building up these queries in complexity to tackle more difficult questions, such as:
Which products should we recommend lab X based on the purchasing behavior of another lab that has had the most similar purchasing behavior to lab X? See the following code:
This query results in 25 products that lab X isn’t purchasing that it may be interested in based on the activity of another lab. Answering questions like this helped us develop a recommendation generation tool that uses our Neptune knowledge graph as the recommendation engine. Performing SQL queries to discover answers to similar questions using a relational database solution requires layers of batch processing and computation, but with Neptune, the process was simplified to a single Gremlin query. We answered a difficult question by simply loading in relationships between two entities (labs and products).
Now imagine the potential that opens up when additional relationships are strategically integrated into this knowledge graph. It starts with posing the questions that can be solved using a graph approach, and bulk loading the appropriate relational data into Neptune using the Amazon Redshift-optimized data engineering process. From there, queries are developed to solve the problems and integrate with downstream applications. This gives us a powerful solution that capitalizes on the strengths of a graph database, but doesn’t require a high degree of data processing due to a powerful data warehousing solution already in place upstream.
Conclusion
Graph database solutions are increasingly becoming a necessity for teams performing analytics to obtain a unique advantage in the types of analyses they can perform. A graph database can be a wonderful tool in a data professional’s toolkit, but it’s essential to use a strategic design process to begin building out a platform that provides practical insights.
In our experience, having a solid data warehousing model and an understanding of the specific types of questions that we wanted to answer using graph algorithms provided the framework to design a purposeful graph database model. It was important for us to start small by migrating one relationship at a time from a relational data model to a graph data model, which ultimately helped us solve very specific questions related to customer behavior and product recommendations. This platform has been used to provide recommendations to customers based on collaborative filtering recipes with proven success.
A similar solution without the use of a graph database required us to build custom algorithms and perform several layers of batch data processing and model training to implement, but our graph-based solution using Neptune showed similar performance while requiring simple traversal queries through customer behavior relationships that were strategically built into the graph. Data engineering played a very active role in providing a performant business intelligence solution. However, we have just scratched the surface. There are a variety of additional advantages to using graph databases that we have yet to explore in order to discover further business insights ranging from simple to complex. Our next steps involve expanding our knowledge graph with additional datasets from our data warehouse that will allow us to take advantage of the precious data available in our analytics ecosystem to augment downstream applications with graph algorithms.
Although graph databases have extreme utility, the process of configuring a system from the ground up may seem like a resource-heavy endeavor for teams interested in integrating a graph database within an existing analytics platform. We recommend using Neptune because it simplifies the engineering process, so that business-facing teams can start using it with minimal effort. AWS provides thorough documentation, and configuration through the Neptune console makes it a breeze to get everything set up. It remains to be seen how Neptune evolves in comparison to other graph database services, but based on our experience thus far, the prospects are exciting.
The content and opinions in this post are those of the third-party author and AWS is not responsible for the content or accuracy of this post.
About the Authors
 Shahria Hossain is a Software Engineer for the Sales Operations Team at Thermo Fisher Scientific. Hailing from a life science background, his goal is to help advance precision medicine efforts globally by engineering one big data analytics platform at a time. In his free time, Shahria enjoys playing ping pong, hiking, and reading motivational books.
 Mikael Graindorge is a Sales Operations Leader at Thermo Fisher Scientific. His passion is to combine his craftsmanship with modern technology by developing new global solutions to drive sales conversion rates, advance life science research, and enable others to reach their full potential. He is also known for his cooking and carpentry skills, and is committed to lifelong learning. Mikael holds a Master’s and a Doctorate specialized in digital commerce growth by utilizing cognitive psychology stimulation.