AWS for Industries
Using cloud-based, data-informed, power system models to engineer utility reliability
Grid simulations power various applications in the utility engineering value chain, from planning to operations. Driven by decarbonization, decentralization and digitization goals, utilities need these model-based simulations to be more detailed, accurate and faster than ever, while leveraging an increasing number of high-resolution grid measurements. This blog introduces some of the challenges associated with data-informed, model-based grid engineering, and describes how utility engineers can use AWS to deliver more value from data while meeting grid simulation needs in a highly scalable and cost-effective manner.
For decades, power system engineers around the world have used physics-based models of the electric grid for various grid management workloads. Advancements in power electronics are reaching the utility industry via High Voltage Direct Current (HVDC) transmission, Flexible Alternating Current Transmission System (FACTS), and Distributed Energy Resources (DERs). Utilities now need to build grid models that are more realistic than ever before to account for more device types and sensors distributed throughout the grid and interactions that can be nonlinear in nature. As a result, utility models have become bigger, and model-based analysis has become more complex, requiring more computational power. This increase in size and complexity of grid-models is evident in the utilities’ need for:
- Modeling distribution secondary networks,
- Modeling three-phase transmission networks, and
- Modeling integrated transmission and distribution (T&D) systems.
Modeling distribution secondary networks
At Hawaiian Electric, rooftop solar is the largest contributor to non-fossil-based energy generation. Nearly half of Hawaiian Electric’s renewable production comes from “customer-sited, grid-connected” renewables, which predominantly consists of rooftop solar. These rooftop solar panels, as well as a growing number of customer-sited storage assets, are connected to small secondary wires behind the distribution service transformers. The electrical characteristics (Resistance-to-Reactance ratio (R/X) ~ 10) of these small wires are very different from those of primary distribution (R/X ~ 1) and transmission conductors (R/X ~ 0.1). Voltage measurements from smart meters, smart inverters, and other sensors have shown a voltage spread of up to 10V (on a 120V nominal) behind the service transformer, or even more in worst cases. Such large voltage spreads have also been observed without any secondary connected DERs, caused only due to long, shared, secondary network topologies. As a result, utility engineers want grid models to account for distribution secondaries and service drops to accurately capture their significant impact on voltages near customer premises – where distribution voltages matter the most.
Modeling three-phase transmission networks
Most conventional transmission analyses assume the transmission system is transposed and fairly balanced. This assumption is very powerful as it allowed power system simulation tools and engineers to model a highly meshed, three-phase transmission network using a positive sequence equivalent that was computationally much easier to solve. However, as several utilities have discovered by analyzing additional measurements from Phasor Measurement Units (PMUs) or synchrophasors, the transmission grid isn’t as balanced as we would like. Significant imbalances are often observed, even in steady-state operations. One can attribute these imbalances to a couple of factors:
- In practice, transmission lines are not always transposed.
- With the proliferation of DERs, as the distribution grid becomes a more active part of the grid, as opposed to being a passive load, it also introduces its inherent unbalanced nature into the transmission grid.
This necessitates the need for three-phase analysis of the transmission grid, which adds more computational burden.
Modeling integrated T&D systems
In its October 2021 filing to the Oregon Public Utilities Commission, Portland General Electric (PGE) estimates that by 2030, as much as 25% of the power needed on the hottest and coldest of days could come from customers and DERs, such as solar panels, batteries, and electric vehicles. Other utilities around the world are expecting similar or even greater contribution to their power needs from the distribution system. With so many energy resources integrating with the distribution grid, leading to bidirectional power flows across an interconnected grid, not only can phase imbalance be potentially exacerbated in the transmission grid, but also, the distribution grid can have a greater impact on transmission system’s steady-state voltage stability limit. This has led to a growing interest in combined T&D grid modeling and simulation.
Combined, these three factors are leading to grid models that are orders of magnitude larger than ever before. For example, for a vertically integrated investor-owned utility serving around 1 million end customers, one could end up with a +6 million component grid model, where the entire grid is modeled as three-phase, making no balanced assumptions, and modeling from 500kV or higher, down to distribution secondaries leading to customer premises, with everything in between. Arguably, for the most accurate analysis, planners should transcend utility boundaries and model the entire interconnected grid, which would be billions of components or more. Utility engineering leaders have a choice to make here: either make do with an “equivalent” grid model, smaller and simpler, but lacking accuracy for the future; or leverage advances in computer science and cloud technologies for more accurate and realistic grid models at an affordable cost.
In addition to modeling complexities, utilities are experiencing a tsunami of grid data. According to the Utility Analytics Institute, there were 2.7 zettabytes of digital data in 2017, and this number is expected to balloon to 175 zettabytes by 2025. A simple example for utilities is the explosion of data from billing meters. Utilities have gone from one read per customer per month to 96 reads per customer per day (and even more with the next generation of smart meters), which represents an increase of 287,900% in just the customer-level energy consumption data. This increase in data, driven by the digitization of the electric grid, can be analyzed directly leveraging AI/ML or stochastic techniques to address several grid management use cases, such as anomaly detection, load modeling, or load forecasting. However, what’s also attractive to most utility engineering leaders is the potential for using data in conjunction with model-based engineering techniques, such as state estimation and model tuning. Besides ever growing data from the grid, power system engineers now must analyze a far greater number of scenarios to account for the variable nature of a decentralized, customer-centric, dynamic power grid. Adding to the challenge is the current engineering system landscape with utilities using different tools across use cases and departments. This leads to fragmented models with different tools yielding different results for the same grid and the need for massive data transfers from different source systems. Duplication of data and models adds to storage and cost concerns. Over time, duplicated information in different locations results in more problems.
An AWS option for utility modeling agility
Throwing AWS’s vast expertise in AI/ML at utility data can solve several important use cases, and leveraging the right AWS compute instances for running existing grid simulation applications can yield performance improvements in the short term. However, to extract the full value of AWS, one must reinvent and transform the field of grid model-based engineering by leveraging a cloud-based architecture that can enable real-time power flow/optimization calculations informed by associated measurements across entire utility service territories and beyond. The following is a high-level architectural framework to facilitate such a transformation.
Single source-of-truth grid model and data
We start with the foundational layer upon which everything else gets built, see Figure 1. This is your grid model and a data lake that can be shared by all applications. Data (measurements and forecasts) can be ingested into an AWS data lake in batches or streamed in real-time. Amazon Simple Storage Service (Amazon S3) provides a cost effective and durable service for creating a data lake, that in turn enables creating ETL pipelines for data massaging, and AI/ML pipelines for specific use cases, such as anomaly detection, load or generation forecasting, and more. An initial, physics-based grid model can be created based on the “as designed” information of the utility grid. Utility-specific design and construction standards, and topology systems such as GIS, can be a very useful for this. Once built, automated updates can be triggered based on data streamed from SCADA, outage management, network management, or other relevant utility applications to maintain an “as-operated” model of the grid. Typically, grid modeling and simulation tools store grid network topology in relational databases. While this is an easy starting point with Amazon Relational Database Service (RDS) or Amazon Aurora Serverless, one can also leverage Amazon Neptune, a fully managed graph database, to store grid topology. Amazon Neptune allows efficient graph traversal with Gremlin. Graph traversal can be integral to several utility algorithms, like grid design for optimal placement of new sensors, DERs, or electric vehicle (EV) charging stations.
A key feature of this foundational layer is that it maintains a single source-of-truth for all grid engineering applications. This avoids model and data duplication, associated time and costs, and the accuracy and management challenges that can arise from having multiple sources of information.
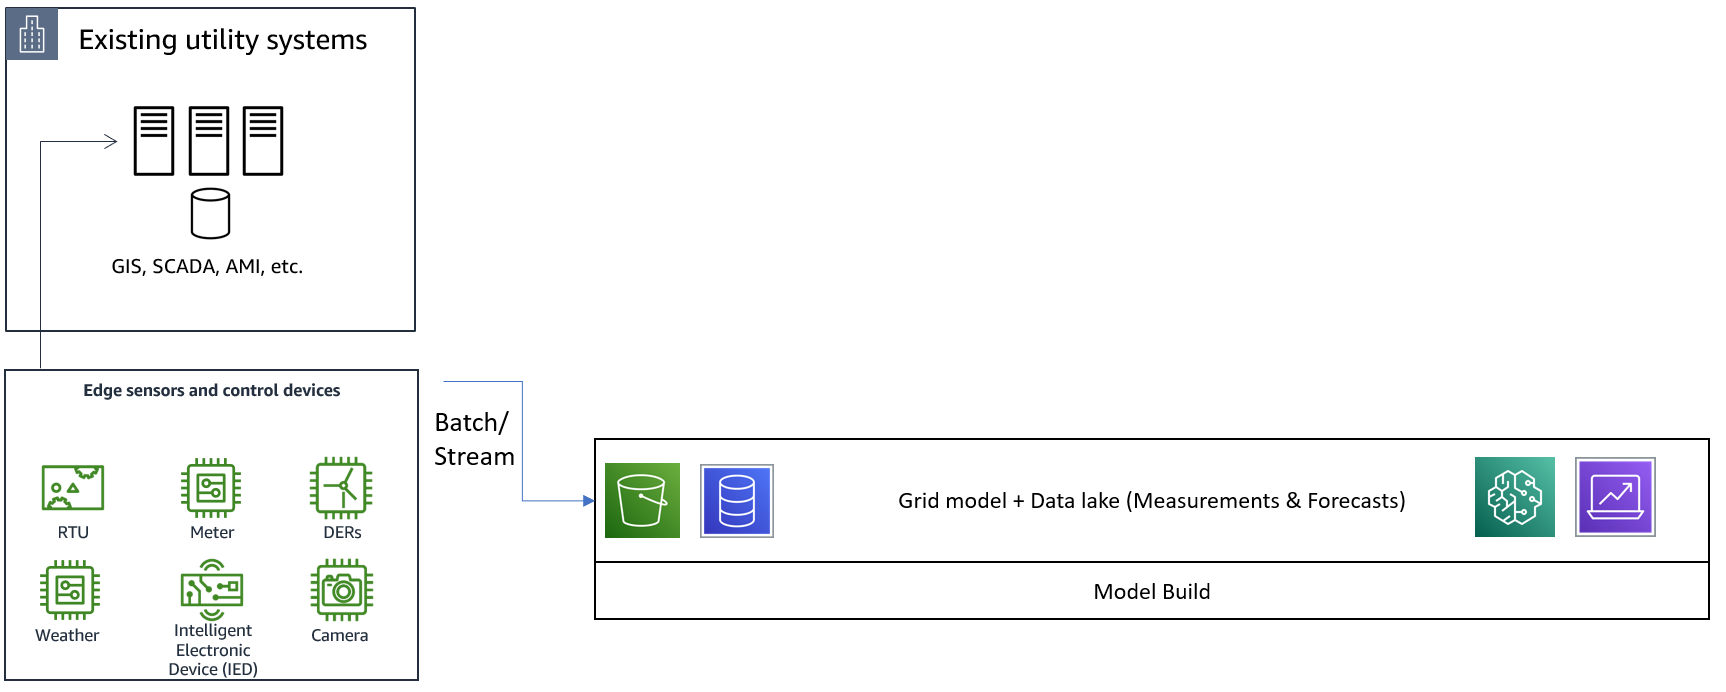
Figure 1: Single source-of-truth: grid model and data lake
Deep learning and high performance computing (HPC) for non-linear, differential-algebraic equations, and non-convex optimization
Next, we build our middle layer that does most of the mathematical heavy-lifting, as shown in Figure 2. This layer houses algorithms for solving algebraic equations for steady-state analysis, or differential equations for dynamic or transient analysis, or non-linear and non-convex optimization problems such as optimal power flow. These algorithms use grid model and data from the foundational layer of the architecture, and can be computationally expensive on extremely large grid models. Deep learning algorithms or reinforcement learning algorithms, both gaining popularity due to the efficiency of machine learning algorithms, can take advantage of Amazon SageMaker or AWS Deep Learning AMIs, which are fully configured with the latest versions of the most popular deep learning frameworks and tools – including PyTorch, MXNet, and TensorFlow. Based on specifics of the numerical analysis algorithm being implemented, it is important to reduce costs and time-to-results by choosing the “right tool for the right job,” leveraging the flexibility of choosing between CPU, GPU, and FPGA instances on-demand. HPC on AWS, scaling to tens of thousands of distributed computations and balancing performance needs with cost constraints, could also be a key enabler for this middle layer. For example, Hpc6a, a new HPC-optimized EC2 instance, can offer up to 65% better price performance over comparable x86-based compute-optimized instances. For low latency exchange of variables between tightly coupled numerical analysis workloads spread across HPC compute nodes, one can use message passing interface (MPI) or NVIDIA Collective Communications Library (NCCL) over Elastic Fabric Adapter (EFA), an Amazon EC2 network device that improves throughput by using its unique OS bypass networking mechanism, and lets you scale to thousands of CPUs or GPUs.
For sharing measurements and forecasts to be used with these numerical algorithms, such as Advanced Metering Infrastructure (AMI)-based load measurements, AI/ML-driven stochastic load forecasts, or SCADA-based voltage measurements, one can use Amazon FSx for Lustre. This allows you to access data directly from your data lake by linking your file system with the appropriate Amazon S3 buckets (foundational layer of the architecture).
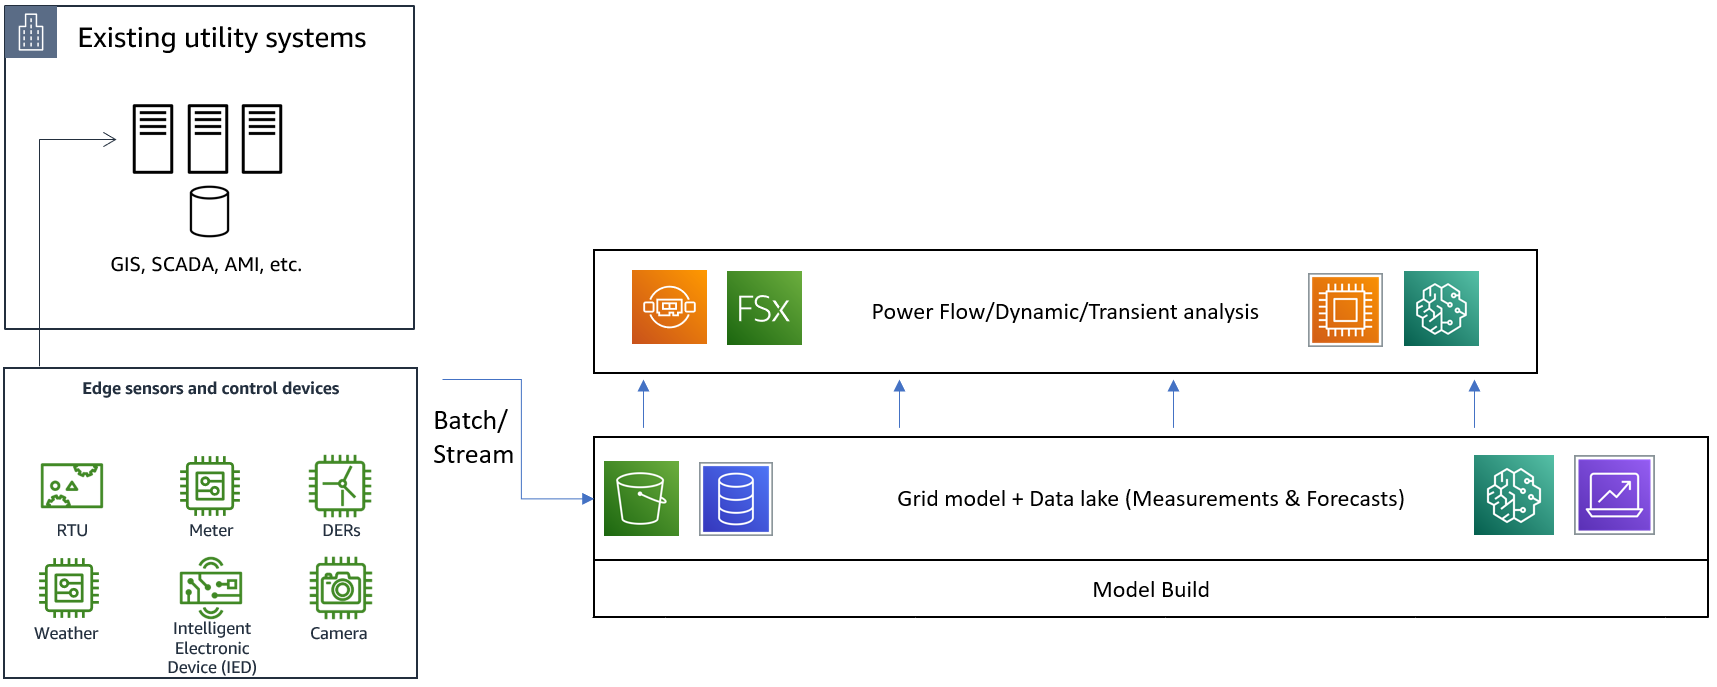
Figure 2: Numerical analysis algorithms using grid models and data from the foundational layer
As an example of the performance boost that HPC technologies can provide, FLYING WHALES, a French startup that is developing a 60-ton payload cargo airship, can now run Computational Fluid Dynamics (CFD) jobs 15X faster thanks to the compute power and inter-node network performance that’s available with Amazon EC2 C5n.18xlarge instances and EFA. Another example is Woodside Energy, which analyzed seismic data with over 1M vCPUs on AWS to deliver insights in hours, 150X faster than its on-premises system. There are several other examples across industries where AWS HPC is delivering massive performance gains, and power engineering calculations should not be an exception.
Business logic-driven power engineering applications
Finally, the topmost layer is where we build applications based on business and engineering needs. For offline applications that support grid planning and analysis, such as transmission needs assessment or DER planning/distribution circuit design, data can be queried from the data lake in the foundational layer. For “online” applications that rely on real-time data for real-time state estimation or situation awareness, or active control of the electric grid, one can tap into the data streams responsible for ingesting the data into Amazon S3-based data lake. All applications get grid models from the foundational layer. This ensures that all business applications use a common source of information. In addition, all top layer applications delegate the undifferentiated heavy lifting of solving complex optimization problems, or differential and/or algebraic equations to the middle layer, while implementing business logic themselves.
For the top layer of applications, developers can choose from a broad selection of features and services across technology categories, from compute and databases to logging and debugging. It is noteworthy that this application development does not necessarily need software engineering experts. For example, power engineers can use AWS Lambda to simply run code, much like they are used to with existing grid simulation tools, without worrying about the provisioning and management of servers. AWS Lambda takes care of everything required to run and scale their code with high availability. Some engineering studies or workflows may require orchestration of different blocks of code in a step-by step manner. This can be achieved using AWS Step Functions, which is a fully managed service that makes it easy to coordinate the components of distributed applications and microservices using visual workflows. Finally, engineers can use ML inference endpoints in real-time to make predictions using pre-trained ML models. Or, they can use Amazon SageMaker Canvas, a new visual, no code capability to build ML models and generate accurate predictions without writing code or requiring ML expertise.

Figure 3: Business-driven applications sharing a common source of model, data, and computational techniques
Let’s look at model management as an example application. It can be implemented by using scheduled events with Amazon EventBridge to periodically trigger a comparison between time series, power-flow based grid state estimates, and measured data available from AMI and other grid sensors. Here, the application would delegate power flow calculations to the middle layer that could implement them using a Newton-Raphson solver, or another numerical analysis technique. Measured data over a chosen time period and across a variety of locations would be queried from the foundational layer. Based on a time-series error profile for calculated versus measured grid states over a predetermined length of time, the application could automatically tune grid impedances as desired. This would help capture field events that may not be captured via SCADA/OMS or existing business processes. Such an application could be implemented and scaled as needed using AWS Lambda, paying per millisecond. This is an example where the application uses the proposed architectural framework to further enable the framework by regularly updating the grid model that’s shared by all other applications.
Utility stakeholders across engineering, operations and business can directly access applications, simulation algorithms, and data from any of the three layers. Third-party engineering consultants or vendor applications can also be provided secure access to the same environment, ensuring all grid engineering studies, simulation tools, and control systems are sharing the same grid model, data, and computational techniques.
Utilities and other industry stakeholders are invited to implement and evaluate this framework, leveraging AWS technology support through collaborative partnership models with the AWS Energy & Utilities team. Visit AWS Power and Utilities for more information.