AWS Cloud Operations & Migrations Blog
Education site ApplyBoard monitors their mission-critical EKS environment using CloudWatch Container Insights
This guest blog post is contributed by Jayat Markan, a DevOps engineer at ApplyBoard. Jayat helps developer teams build and run a stable and highly available application platform.
ApplyBoard’s online platform enables international students to apply to educational institutions across the United States and Canada. This blog post discusses how ApplyBoard set up monitoring on an Amazon EKS environment using Amazon CloudWatch Container Insights.
In a mission-critical production environment like this, efficiently monitoring application infrastructure is important. CloudWatch Container Insights helps you collect, aggregate, and summarize metrics and query logs from Amazon ECS, AWS Fargate, Amazon EKS, and Kubernetes environments. It allows you to collect logs and metrics to monitor critical resources in container environments. You can also set CloudWatch alarms on the metrics that Container Insights collects.
Overview
At ApplyBoard, user experience is a critical requirement. The application must be highly available, perform well, and able to scale quickly to meet demand
“Having our system and services available and performant is critical for us to achieve our goal of helping students achieve their education goals. Using Amazon CloudWatch to monitor is a key ingredient to help ensure that performance and availability requirements are met,” explains Hiep Vuong, VP Engineering at ApplyBoard.
ApplyBoard uses Amazon EKS to host a variety of microservices to support their application environment. It is critical to be able to monitor the EKS environment for performance and health to ensure high availability.
Problem
The IT team at ApplyBoard initially set up a monitoring solution for the EKS environment using a collection of third-party tools. This created additional overhead for the DevOps team to maintain, manage, update, and secure. The team decided to find a new solution that was concise, easy to maintain, fully featured, and native to AWS.
Approach
After analyzing various solutions rigorously, the IT team decided to use CloudWatch Container Insights to set up monitoring and observability on their EKS environment.
When configured on an EKS cluster, Container Insights automatically provides customized dashboards. These dashboards show container health and performance information at various levels such as cluster, service, node, pod, and container.
Setting up CloudWatch Container Insights
Container Insights is easy to set up, using the quick setup guidelines allowed configuration of the EKS cluster to send logs and metrics to CloudWatch.
Once Container Insights is configured, you can see automated dashboards with a variety of widgets showing several metrics such as CPU utilization, memory utilization, disk usage, and network aggregated across all clusters in the AWS account as shown in the following screenshot.
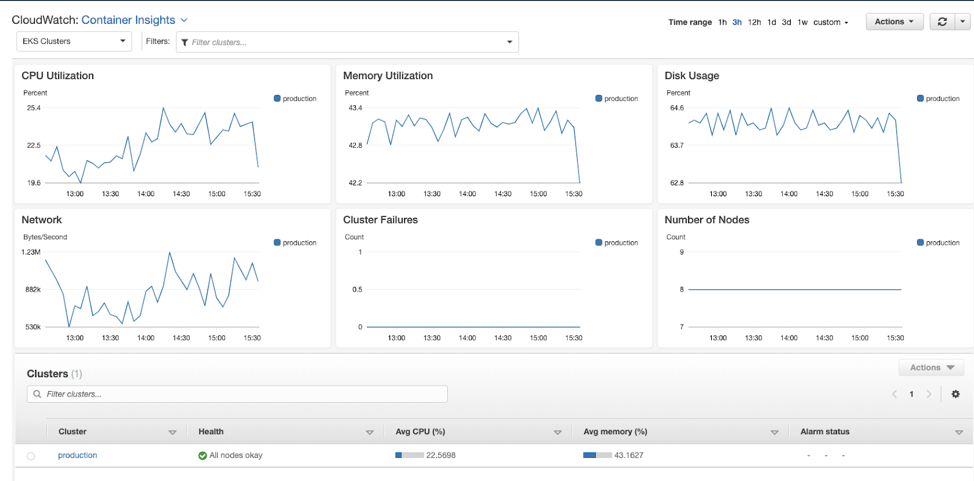
By keeping track of the application infrastructure, ApplyBoard is aware of the capacity provisioned for the EKS environment. This enables them to make adjustments for efficient use of the environment, while keeping costs as low as possible.
The DevOps team responsible for operating this particular application environment wants to monitor the health and performance of the EKS cluster the application is hosted on. You can easily see details at the cluster level by simply choosing the name of the cluster in the Filters dropdown list. This is shown in the following screenshot.

By selecting the cluster name and choosing from the Actions dropdown list, you can also see application logs, performance logs, control-pane logs, data-pane logs, and host logs at the cluster level. This is shown in the following screenshot.

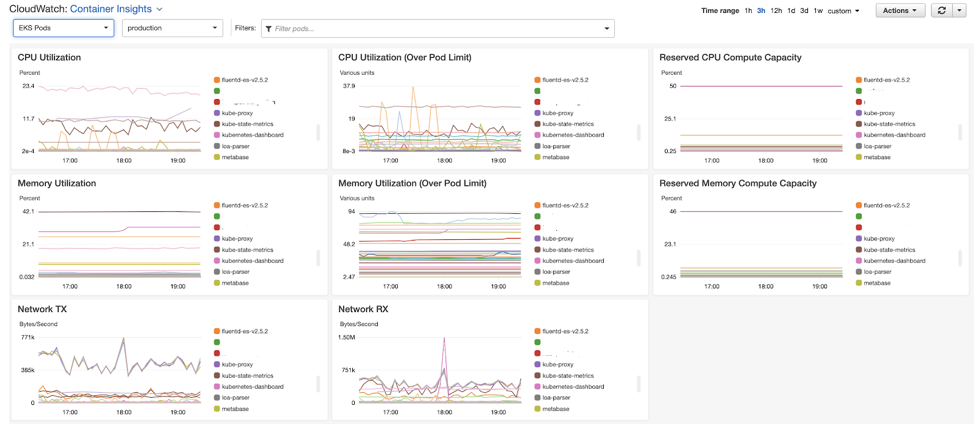
The application development teams are especially interested in monitoring the environment at the pod, container, and node levels. This helps them understand how their application is working and if there are any problems that could cause service quality issues for their customers. Using the filter dropdown list, you can simply select the specific pod, container, or node.
Container Insights provides customized dashboards for different EKS resources. The dashboard shows pod-specific metrics such as Reserved CPU Compute Capacity and Reserved Memory Compute Capacity. This is shown in the following screenshot.
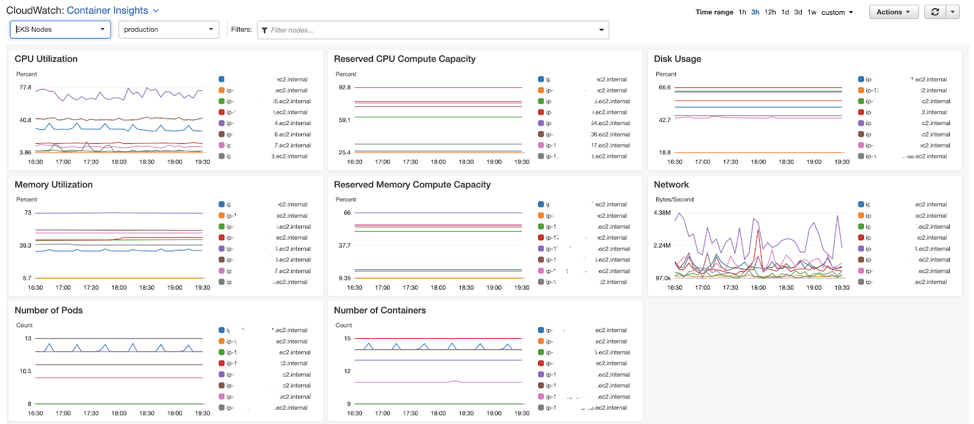
The node-level view automatically shows metrics such as disk usage, CPU utilization, memory utilization, and network traffic. It also helps you understand if the pods are placed across nodes as desired. This allows you to be informed when adjusting pods to achieve optimal resource usage and higher performance.
ApplyBoard uses purpose-built query language to get insight into the EKS environment. For example, the following query shows the node failures in the EKS cluster you are interested in.
stats avg(cluster_failed_node_count) as CountOfNodeFailures
| filter Type="Cluster"
| sort @timestamp desc
Another frequently used query is the following one, which shows error counts by container name in descending order. This helps developers understand the behavior of their containers running in the production environment.
stats count() as countoferrors by kubernetes.container_name
| filter stream="stderr"
| sort countoferrors desc
You can also drill down to a specific container to see the number of errors occurring in it by using the following query:
stats count() as CountOfErrors by kubernetes.namespace_name as Namespace, kubernetes.container_name as ContainerName
| sort CountOfErrors desc
| filter Namespace like "<name_of_the_namespace>" and ContainerName like "<name_of_container>"
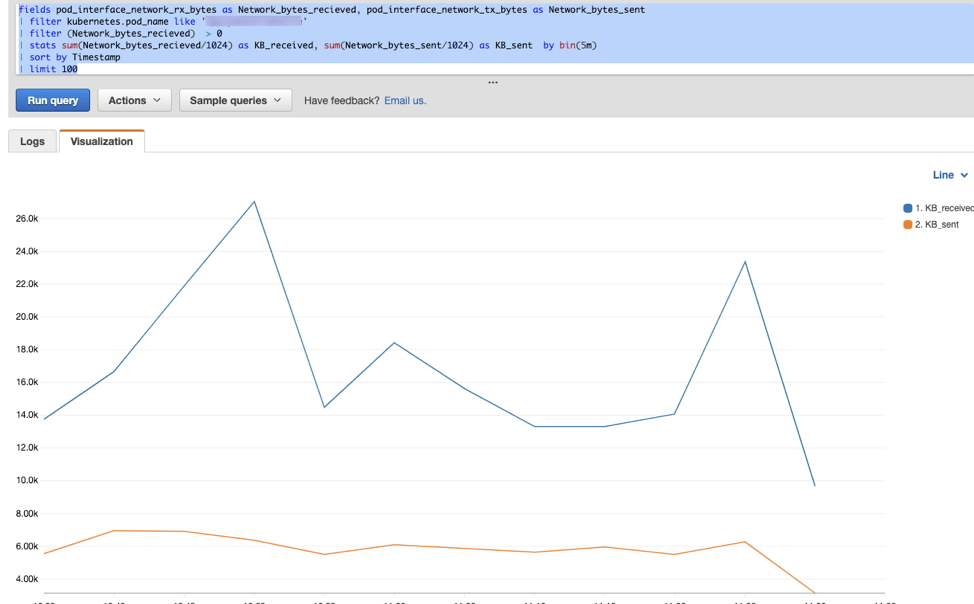
The following query shows the amount of data received (in KB) and sent by a specific pod every five minutes:
fields pod_interface_network_rx_bytes as Network_bytes_recieved, pod_interface_network_tx_bytes as Network_bytes_sent
| filter kubernetes.pod_name like 'applyboard-website'
| filter (Network_bytes_recieved) > 0
| stats sum(Network_bytes_recieved/1024) as KB_received, sum(Network_bytes_sent/1024) as KB_sent by bin(5m)
| sort by Timestamp
| limit 100
The following query shows the top 10 pods restarted in the environment. This helped resolve a critical issue in a specific part of the application infrastructure that was hard to identify before configuring CloudWatch Container Insights.
stats max(pod_number_of_container_restarts) as Restarts by PodName, kubernetes.pod_name as PodID
| filter Type="Pod"
| sort Restarts desc
| limit 10

The ApplyBoard team also built a custom dashboard with a variety of interesting charts, which provides insights into different components of the EKS cluster. The following screenshot shows its custom dashboard.
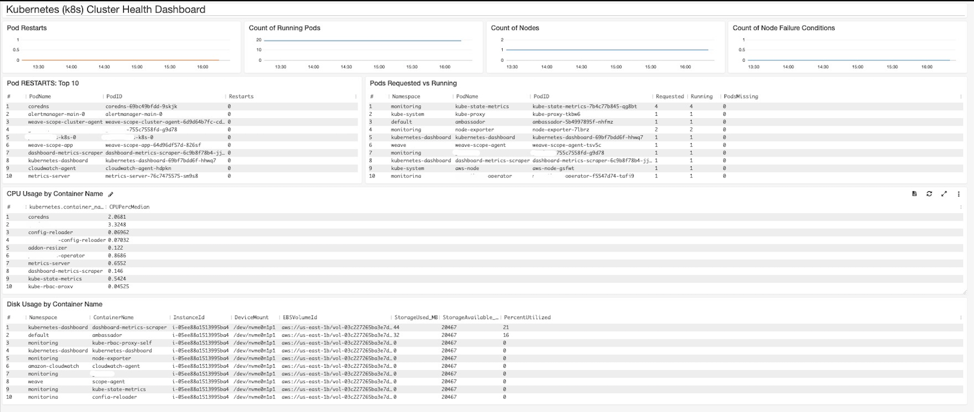
In addition to these ad hoc queries, and custom and generic dashboards, ApplyBoard also uses CloudWatch alarms. The alarms monitor Container Insights metrics and alert the operations team as soon as an issue is detected in the environment. For example, there is an alarm that monitors CPU use for ApplyBoard’s website pod. If CPU usage of the Pod exceeds 75%, the alarm will page the DevOps team. This is shown in the following screenshot.


Conclusion
This post demonstrated how ApplyBoard uses Amazon CloudWatch Container Insights to monitor their mission-critical application environment hosted on Amazon EKS. With this setup, the DevOps team at ApplyBoard is able to gain deep insight into the environment with few or no maintenance tasks. The teams are able to effectively use their time on business-critical activities, reduce mean time to remediation (MTTR) for customers, and provide high-quality service. To learn more about Container Insights, take a look at the documentation or explore our console.
Author

Jayat Markan is a DevOps engineer at ApplyBoard Inc., where Jayat helps the developer teams have a stable and highly available application platform.
Jayat has worked in various technical roles in companies such as Expedia over the last 12 years. DevOps has been his forte for the last 3 years or so and he is passionate about working on cloud infrastructure.
When not working, Jayat enjoys cooking, reading about different world cuisines, and going for daily runs (weather permitting).